Logistic Regression
Contents
Logistic Regression
In this notebook, we will perform logistic regression and then evaluate the model’s performance.
Logistic Regression is a method used for classification of data. It estimates posterior probabilities (the probability that the data point belongs to a class) and based on that it classifies the data point.
Import necessary packages
import numpy as np
import pandas as pd
import matplotlib.pyplot as plt
from sklearn.linear_model import LogisticRegression
from sklearn.metrics import accuracy_score,precision_score,recall_score,f1_score,ConfusionMatrixDisplay, RocCurveDisplay,PrecisionRecallDisplay
import pickle

import diagnosis
Load the data
train_data = pd.read_csv('../data/train.csv')
val_data = pd.read_csv('../data/val.csv')
test_data = pd.read_csv('../data/test.csv')
Preparing for training and validation
X_train,X_val,y_train,y_val = diagnosis.preprocessing(train_data, val_data)
Built the model and training
# Built the model
model = diagnosis.logistic_regression(X_train,y_train)

# get the predictions
y_preds = diagnosis.logistic_regression_predict(model, X_val)
Function for all the measured metrics
# get the necessary metrics
diagnosis.get_metrics(y_preds,y_val)
Accuracy is: 0.9278350515463918
Precision is: 0.8857142857142857
Recall is: 0.9117647058823529
F1 score is: 0.8985507246376812
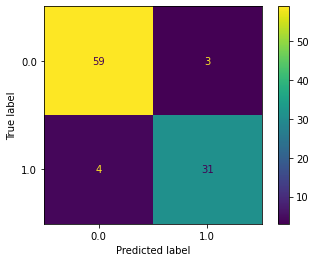
Creating confusion matrix and Saving it
ConfusionMatrixDisplay.from_predictions(y_val,y_preds);
plt.savefig('../figures/confusion_matrix_logistic.png')
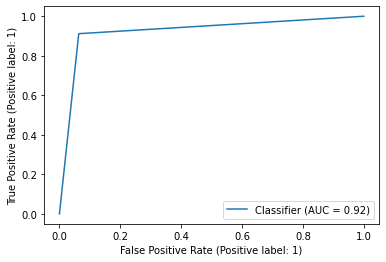
Create the ROC Curve and Saving it
RocCurveDisplay.from_predictions(y_preds,y_val);
plt.savefig('../figures/roc_curve_logistic');
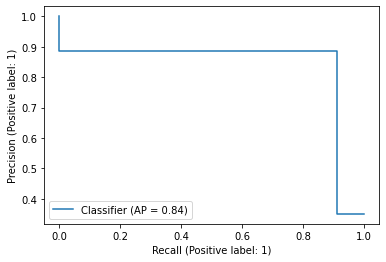
Create Precision Recall Curve and Saving it
PrecisionRecallDisplay.from_predictions(y_preds,y_val);
plt.savefig('../figures/precision_recall_curve_logistic');
# save the linear model to disk
filename = '../models/lg_model.sav'
pickle.dump(model, open(filename, 'wb'))